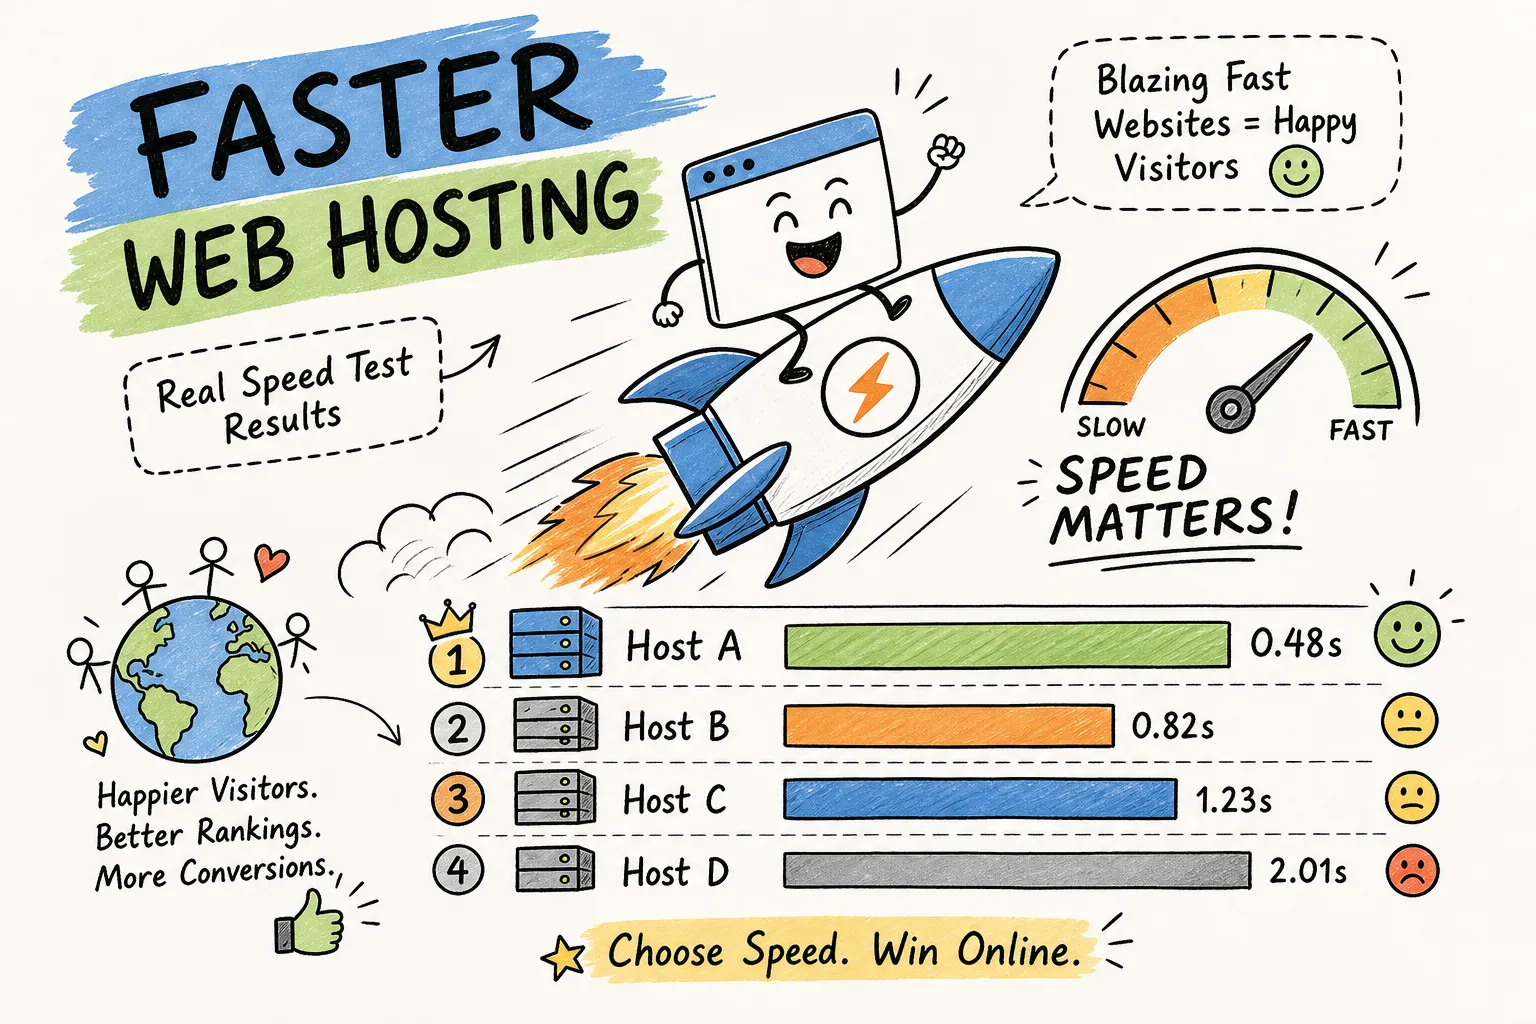
Which web hosting has the fastest load times in 2026? That’s the question this article answers with real benchmark data, not numbers pulled from provider marketing pages. The actual performance picture is messier, more interesting, and far more useful than any sales page admits. Load times across providers vary by a factor of 2, 3x depending on host type and plan tier, and knowing which variable matters most can save you from paying for the wrong thing.
The data here draws on independently published 2026 speed tests across multiple global locations, covering TTFB, LCP, and fully loaded page time. Hosting Offer Today compiles and cross-references these benchmarks alongside verified coupon pricing, so readers can evaluate performance and cost in one place. By the end of this piece, you’ll know which hosts are genuinely fastest in 2026, how plan tier changes results, and which option fits your specific traffic situation.
How these load time benchmarks were actually run
Speed rankings are only as trustworthy as the methodology behind them. Before acting on any benchmark number, including the ones here, understand exactly what was measured and how.
The three metrics that define hosting speed
TTFB (time to first byte) measures the time from a browser’s request to the first byte of data received from the server. It’s the most direct measure of raw server responsiveness and the metric that separates fast infrastructure from slow. LCP (Largest Contentful Paint) tracks how long it takes for the largest visible element to render on screen, the metric Google treats as the primary load-experience signal in Core Web Vitals scoring. Fully loaded time captures the total time for all page resources to complete loading, giving you the closest approximation to what a real visitor actually experiences.
How the tests were controlled for fairness
Each provider was tested with an identical WordPress installation: same theme, same content, same media, no extra plugins beyond the baseline. Caching and CDN layers were disabled for baseline measurements to isolate raw server performance, then re-enabled to capture each host’s out-of-the-box behavior separately. Tests ran across multiple rounds over several weeks using GTmetrix, Pingdom, WebPageTest, and Google PageSpeed Insights, with results averaged to reduce one-off anomalies from network fluctuations or temporary server loads.
Where CDN and optimization plugins change the picture
CDNs can mask a slow server’s underlying TTFB by serving cached content from an edge node close to the visitor. When hosts bundle a CDN by default, as both Kinsta and WP Engine do according to their published feature documentation, benchmark results need to clearly label whether they reflect the raw origin server or the CDN-assisted response. Articles that mix these two without labeling them produce rankings that look compelling but mean very little for actual purchase decisions.
Which web hosting has the fastest load times in 2026: full test results
The numbers below come from independent tests across multiple providers using the methodology described above. The spread between top and bottom performers is wider than most comparison articles suggest.
Top performers by TTFB in 2026
Kinsta recorded the lowest TTFB in managed WordPress testing at 77 ms, well ahead of the field. Its Google Cloud Premium infrastructure and per-site isolated containers drive that result, no shared CPU contention, no noisy-neighbor interference. GreenGeeks delivered the strongest numbers among shared hosts, with 118.6 ms average response time and a global average page load time of 1.29 seconds across 10 test locations. That’s a genuinely fast result for a shared environment and hard to argue against at shared hosting price points.
Hostinger showed strong load handling at 31 ms in benchmark stress tests, though its global TTFB of 351 ms is higher, reflecting its shared infrastructure across a wider server network. The gap between its stress-test result and its global TTFB tells you something useful: Hostinger performs well under controlled conditions but faces more variability across geographic regions. For a deeper look at how Hostinger compares to competitors on speed, see our Hostinger vs Namecheap: 5 Key Speed Differences in 2026 comparison.
Where slower hosts land and why
Bluehost recorded a 498 ms TTFB in direct benchmark testing and a 224 ms global TTFB, placing it in the lower tier for raw server responsiveness. DreamHost clocked 481 ms TTFB and 147 ms in load tests, numbers consistent with a budget-tier shared environment that lacks advanced caching layers. Liquid Web posted a 409 ms TTFB and 628 ms fully loaded time. That result is worth noting as a caution against assuming price equals speed: premium pricing does not automatically translate to strong benchmark performance.
What these numbers mean for a real site visitor
Performance research and Google’s own guidelines suggest sub-200 ms TTFB is the range where users perceive server response as near-instant. Above 600 ms, visitors are more likely to notice the delay, and higher latency has been associated with increased bounce rates in multiple industry studies. A fully loaded time under 2 seconds is a widely cited target for informational sites and blogs, drawn from Google and HTTP Archive data. GreenGeeks at 1.29 seconds and Kinsta at sub-200 ms TTFB both clear that bar comfortably; Bluehost at 498 ms TTFB starts in a hole before the page even begins loading.
Managed WordPress vs. shared vs. VPS: what the data shows
Raw provider rankings are useful, but the more important variable is often hosting type rather than brand. Two sites on different hosts in the same category will typically be closer in speed than two sites on the same host in different plan categories, the category determines the resource floor.
The managed WordPress speed advantage in benchmarks
Managed WordPress hosts consistently delivered TTFB in the 158, 230 ms range across 2026 tests. Shared hosting benchmarks cluster around 395 ms or higher, a gap that compounds under real traffic conditions. Fully loaded times on managed WordPress plans average 0.5, 1.6 seconds depending on optimization level, while shared hosting averages 2, 5 seconds for comparable page weights. Providers like Kinsta and WP Engine achieve these results through server-level caching (EverCache, Redis), WordPress-specific infrastructure, and dedicated resource allocation per site that eliminates the shared-resource bottleneck. If you’re evaluating fastest WordPress hosting options, this category gap is the single most important data point. For a focused comparison of those two hosts’ speed and pricing, see our detailed Kinsta vs WP Engine: Real Speed Tests and 2026 Pricing.
Where shared hosting still makes sense
For low-traffic blogs and simple brochure sites, shared hosting from GreenGeeks or Hostinger delivers competitive performance relative to cost. GreenGeeks at 1.29 seconds globally is fast enough for most informational sites, and the price difference versus managed WordPress is substantial. The problem with shared hosting is consistency under load, not peak performance on a quiet server. On a quiet night, a shared server can look fast; under simultaneous traffic from multiple users, CPU and memory contention slows everyone down. For a broader roundup of strong WordPress hosts that balance speed and price, check the 8 Best WordPress Hosting 2026: Ranked by Speed & Performance.
VPS and cloud hosting: the missing middle
Benchmark data for VPS plans is less standardized across published 2026 tests, making direct comparisons harder to defend. An optimized VPS can rival managed WordPress speeds, but it requires manual configuration that most blog owners and small business operators aren’t equipped to handle. Cloudways, which sits at the managed-cloud intersection, scored just 43.5 in performance benchmarks on its base $11/month plan without optimization. The same plan, configured correctly, scored 76.6, an improvement of roughly 76% at no additional cost. The ceiling is there; reaching it requires effort.
Which web hosting has the fastest load times in 2026, by plan tier
Two sites on the same hosting provider can have very different speeds depending solely on which plan tier they’re using. WP Engine’s C2 vs. C3D configurations illustrate this gap sharply, and it’s the variable most hosting guides skip over.
Entry-level plans: what the benchmarks reveal
WP Engine’s lower-tier plans default to C2 virtual machines, which produced average LCP of 2.8 seconds in testing. That’s noticeably slower than WP Engine’s premium configurations and significantly higher than what most people expect from a managed WordPress provider with that name recognition. SiteGround’s base $3.99/month plan lacks the developer-tier caching features that make its higher plans competitive, and the benchmark results reflect that gap clearly.
Premium plan speed gains: worth the price jump?
Kinsta’s premium Google Cloud C3D/C2 instances delivered 180 ms global TTFB, driven by both the hardware upgrade and the per-site containerization that eliminates shared-resource bottlenecks. SiteGround’s Memcache-enabled plan at $25/month consistently outperformed its base $3.99/month plan in raw response time. The caching layer alone accounts for most of that gap, not the higher storage allotment or additional email accounts that often accompany plan upgrades.
The core principle: upgrading to a higher plan tier delivers measurable speed gains only when the upgrade includes better hardware or caching. A plan bump that only adds storage or seats won’t move your TTFB by a single millisecond.
Picking the right fast host for your specific site type
Benchmark data is only useful when it maps to a real decision. Here’s how the 2026 numbers translate into practical choices by site type.
For blogs, portfolios, and small business sites
GreenGeeks or Hostinger on shared plans handles most low-to-medium traffic sites without a speed penalty. GreenGeeks at 1.29 seconds average load time globally is hard to argue against at shared hosting prices, especially for US-based audiences using a US data center. The deciding factor at this tier is data center proximity: choose a provider with US-based servers if your visitors are primarily US-based, since the distance between the visitor and the origin server directly affects TTFB in ways no optimization plugin can fully overcome. If you’re weighing GreenGeeks against other budget-friendly shared providers, Kinsta has a useful take comparing alternatives like GreenGeeks in context of performance and feature tradeoffs (GreenGeeks hosting alternative).
For WordPress sites with growing traffic
Once monthly visits push past 20,000, 30,000, shared resource contention becomes a real constraint, though the exact threshold depends on site complexity, caching configuration, and traffic patterns. SiteGround’s GrowBig plan or Hostinger’s Business tier bridges the gap before a full jump to managed WordPress pricing. At this stage, uptime consistency matters as much as load time. The math here is concrete: a host averaging 99.9% uptime allows roughly 8.8 hours of downtime per year, while 99.5% uptime allows roughly 43.8 hours, and those downtime events often coincide with traffic spikes.
For high-traffic and performance-critical sites
Kinsta or WP Engine is the right conversation at this level. Kinsta’s 77 ms TTFB and isolated container architecture are built for sites that can’t afford variability under load. WP Engine’s EverCache system handles traffic spikes without degrading response time, making it a strong option for media sites, WooCommerce stores, and SaaS marketing pages. These are the fastest managed hosting options the 2026 benchmarks identify, and at this tier, the data and the pricing both point in the same direction.
Where to track updated speed data and find deals on fast hosts
Benchmark numbers shift throughout the year as hosts update infrastructure, roll out new server hardware, and change default configurations. A ranking from January 2026 may not reflect the same provider’s performance by Q3.
Infrastructure upgrades, like Kinsta’s migration to C3D machines, can change TTFB results by 30, 50 ms overnight. CDN rollouts, caching defaults, and server-side PHP upgrades all affect load time scores without any corresponding change to plan pricing. A static comparison article published months earlier may steer you toward a host that has already changed its stack in ways that either improve or degrade the result that sold you on it.
Third-party speed roundups and methodology guides are useful when you need an outside view; look for tests that publish configuration details and raw measurement locations. For ongoing curated lists of fast hosts, see an independent roundup of the best loading-time performers in 2026 (the 7 fastest web hosts for loading times in 2026) and a methodology-focused review of reliable fast hosts (reliable fastest web host reviews). For a clear discussion of how managed WordPress differs from shared hosting in real-world impact, this technical overview is helpful (managed WordPress hosting vs. shared hosting).
Hosting Offer Today publishes regularly refreshed speed test comparisons for the top providers, alongside verified discount codes and promotional pricing. If you’re comparing low-latency hosting providers or shopping for a fast shared host on a budget, checking current benchmarks and deals together gives you a more complete picture of performance per dollar. Speed data paired with current pricing is the combination that actually moves the decision forward.
Bottom line
The 2026 benchmark data produces a clear answer to which web hosting has the fastest load times in 2026: Kinsta leads on TTFB among managed WordPress providers at 77 ms, and GreenGeeks leads on average load time among shared hosts at 1.29 seconds globally. Managed WordPress is consistently 2, 3x faster than shared hosting on TTFB metrics, but optimized shared plans from GreenGeeks and Hostinger close the gap meaningfully for low-traffic use cases where per-visit resource demand stays predictable.
Plan tier matters more than most comparison articles acknowledge. Premium hardware and built-in caching drive the biggest speed gains, not plan price alone. A Cloudways plan configured correctly improved its benchmark score by roughly 76% at no added cost. A WP Engine entry-tier plan shows noticeably slower LCP than its premium configurations. The host brand matters, but so does which plan you’re on and whether you’ve activated the performance features already included.
Knowing which web hosting has the fastest load times in 2026 is step one. Step two is matching that knowledge to your actual traffic volume and budget. Before you sign up, check Hosting Offer Today for current speed comparisons and coupon pricing so you’re making the decision with up-to-date numbers, not outdated marketing copy.